
Buildings and Grounds
Therms and Electricity
CWU is carefully tracking its electricity and gas consumption, and working to reduce consumption despite increasing building square footage.
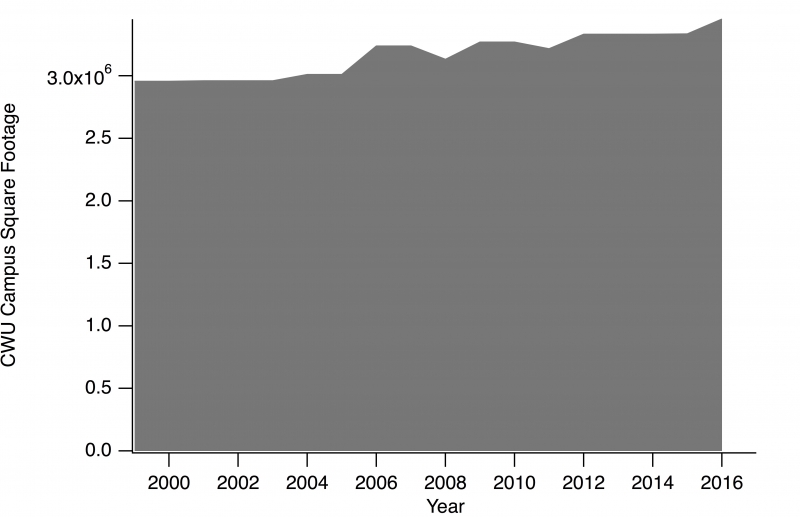
The size of CWU's building footprint (campus square footage) increased during 1999-2016 with the addition of new buildings.
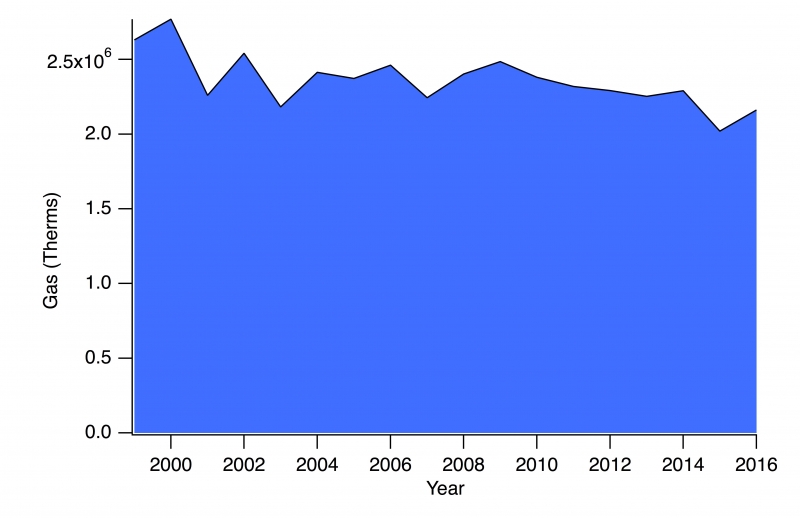
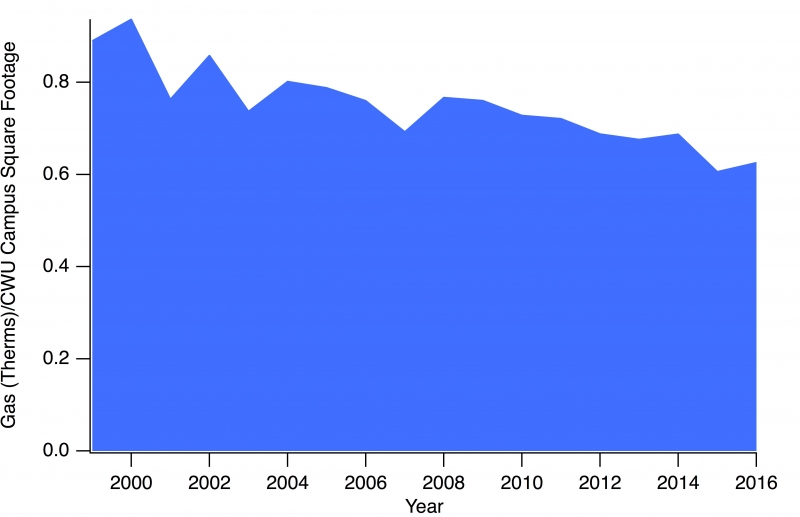
With improved energy efficiency measures, consumption of gas (therms) has decreased during this time, despite the increase in campus building footprint.
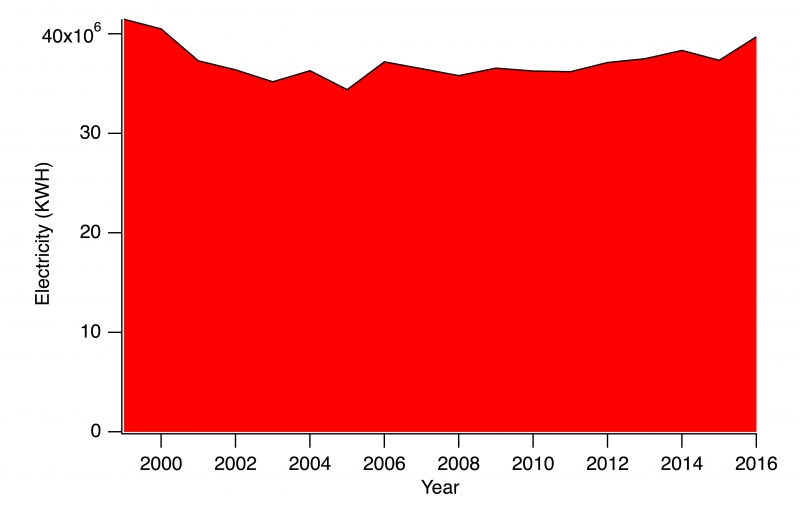
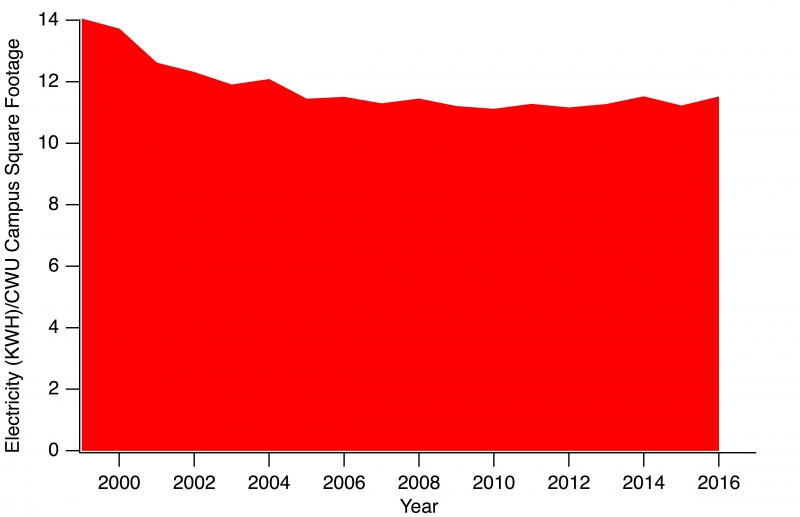
CWU electricity consumption (1999-2016)CWU electricity consumption/square footage (1999-2016)
Total electricity consumption at CWU has fluctuated over time with changing square footage. The electricity/campus square footage data indicates electricity efficiency improvements over time.
CWU News
Douglas Honors College at CWU to celebrate 50 years (part 1)
July 15, 2026 by Tran Nha Pham

CWU professor saving lives in Cameroon through his love of soccer
July 13, 2026 by Rune Torgersen