Diversity, Equity, Inclusivity
Diversity Statistics
Traditionally Under-Represented Student Groups (TUSG) were used to report the data below. TUSG includes all races except for European/Middle Eastern/White and Not Reported.
If the student choose not to answer either question, they are considered unknown or not reported.
The workforce diversity data presented below utilizes the IPEDs Race/Ethnicity methodology where if an employee indicates Hispanic identity, or their Visa and Citizenship status indicates they are a Non-Resident Alien, those statuses take precedence over any race selection. If the employee chose not to answer either question, they are considered unknown or not reported.
Traditionally Underserviced Students
This table shows the percentages for which students have been underserviced by year.
| Academic Year | TUSG | Unknown | White |
|---|---|---|---|
| 2016-2017 | 31% | 13% | 55% |
| 2017-2018 | 33% | 12% | 54% |
| 2018-2019 | 34% | 11% | 55% |
| 2019-2020 | 35% | 12% | 53% |
| 2020-2021 | 40% | 6% | 54% |
Student Diversity - 5 Year Trend
Between Fall 2016 and Fall 2020 student diversity increased 9 percentage points. 2016 31%; 2017 33%; 2018 34%; 2019 35%; 2020 40%Workforce Diversity – 5 Year Trend
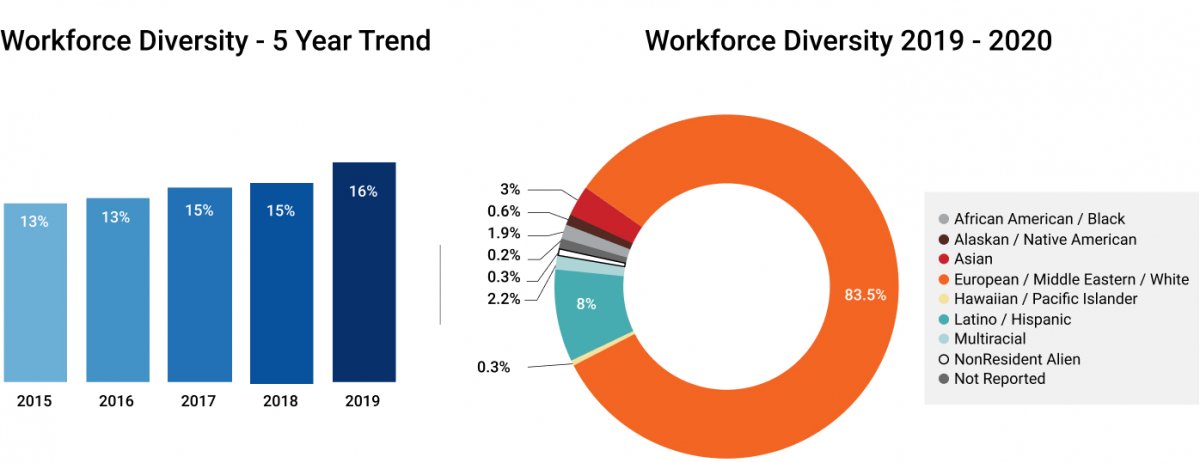
Between 2015 and 2019 employee diversity increased 3 percentage points. 2015 13%; 2016 13%; 2017 15%; 2018 15%; 2019 16%.
Workforce Diversity 2019-2020
The total employee count for Fall 2019-2020 is 1,946 with 317 employees identifying as coming from a traditionally under represented group. The breakdown of race/ethnicity is 83.5% European/Middle Eastern/White; 8% Hispanic/Latino; 2.2% Multiracial; .2% Not Reported; 3% Asian; 1.9% African American/Black; .3% Hawaiian/Pacific Islander; .6% Alaskan/Native American.
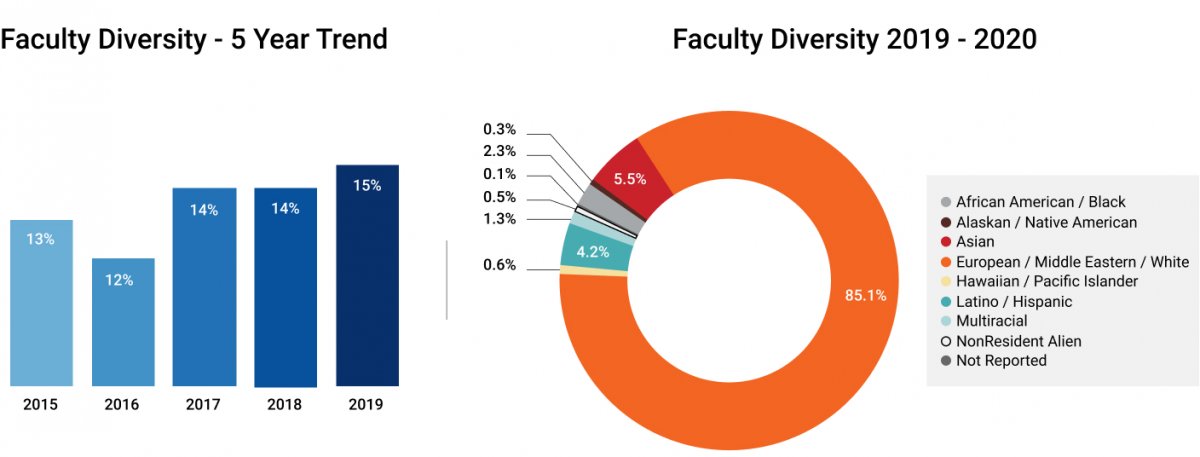
Faculty Diversity – 5 Year Trend
Between 2015 and 2019 faculty diversity increased 2 percentage points. 2015 13%; 2016 12%; 2017 14%; 2018 14%; 2019 15%.
Faculty Diversity 2019 – 2020
The total faculty count for Fall 2019-2020 is 777 with 115 faculty identifying as coming from a traditionally under represented group. The breakdown of race/ethnicity is 85.1% European/Middle Eastern/White; 4.2% Hispanic/Latino; 1.3% Multiracial; .1% Not Reported; 5.5% Asian; 2.3% African American/Black; .6% Hawaiian/Pacific Islander; .3% Alaskan/Native American.Staff Diversity – 5 Year Trend
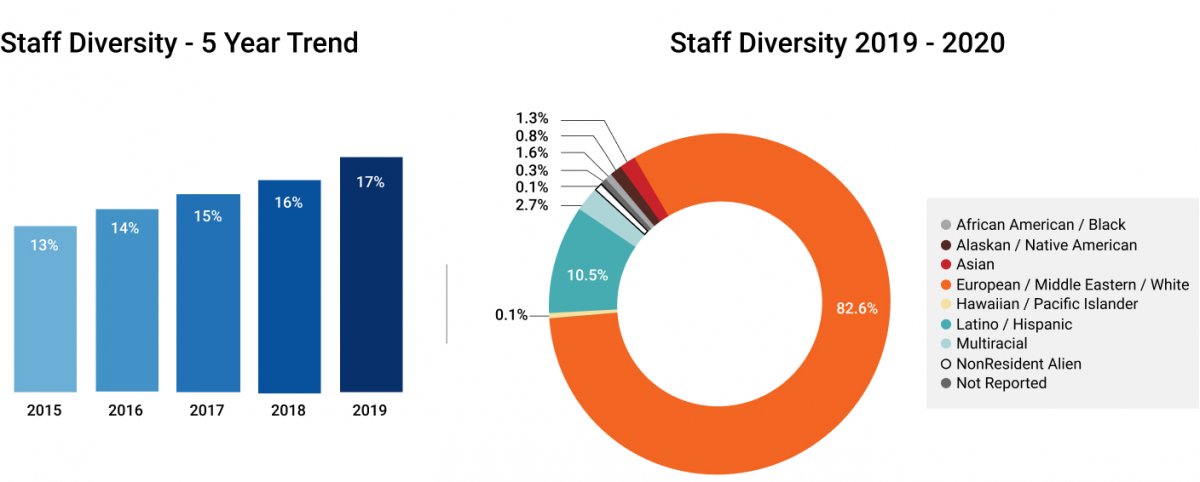
Between 2015 and 2019 staff diversity increased 4%. 2015 13%; 2016 14%; 2017 15%; 2018 16%; 2019 17%.
Staff Diversity 2019 – 2020
The total staff count for Fall 2019-2020 is 1,188 with 204 staff identifying as coming from a traditionally under represented group. The breakdown of race/ethnicity is 82.6% European/Middle Eastern/White; 10.5% Hispanic/Latino; 2.7% Multiracial; .3% Not Reported; 1.3% Asian; 1.6% African American/Black; .1% Hawaiian/Pacific Islander; .8% Alaskan/Native American.
CWU News
Latest edition of Voyage Magazine available online
April 24, 2024
by University Relations
CWU defensive standout presented with coveted national award
April 24, 2024
by David Leder